A calendar that tells history
Designed a unique interactive print calendar to celebrate UNICEF’s 70th year in India and its key milestones in our country through an exquisite mobile application.
Celebrating UNICEF’s 70th anniversary felt like an appropriate time to build awareness about these interventions and bring them into focus.
We designed a vertical table calendar to occupy less space on the UNICEF's prime stakeholders.
Each spread contains two part— one is calendar part with a vertical layout aligning with overall form factor: two, Illustration that tells a story.
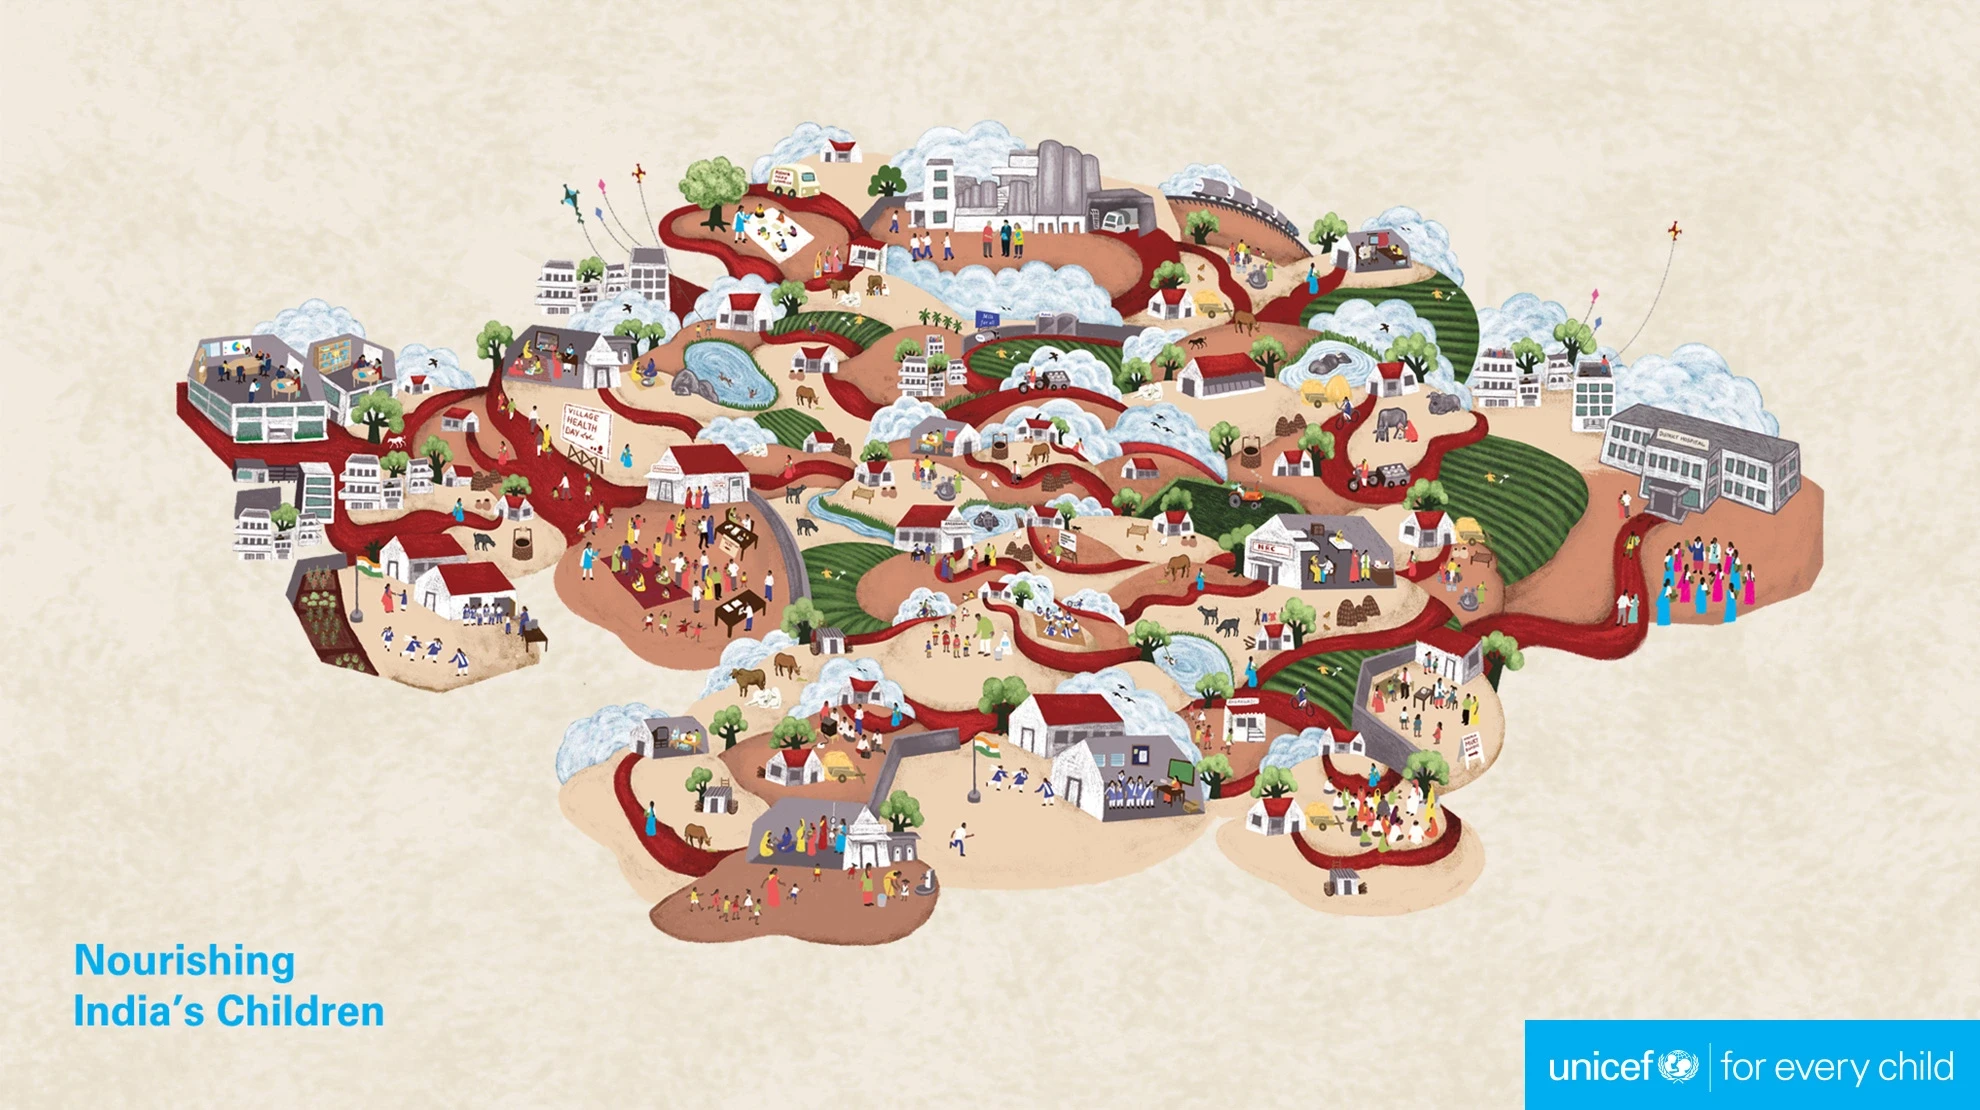
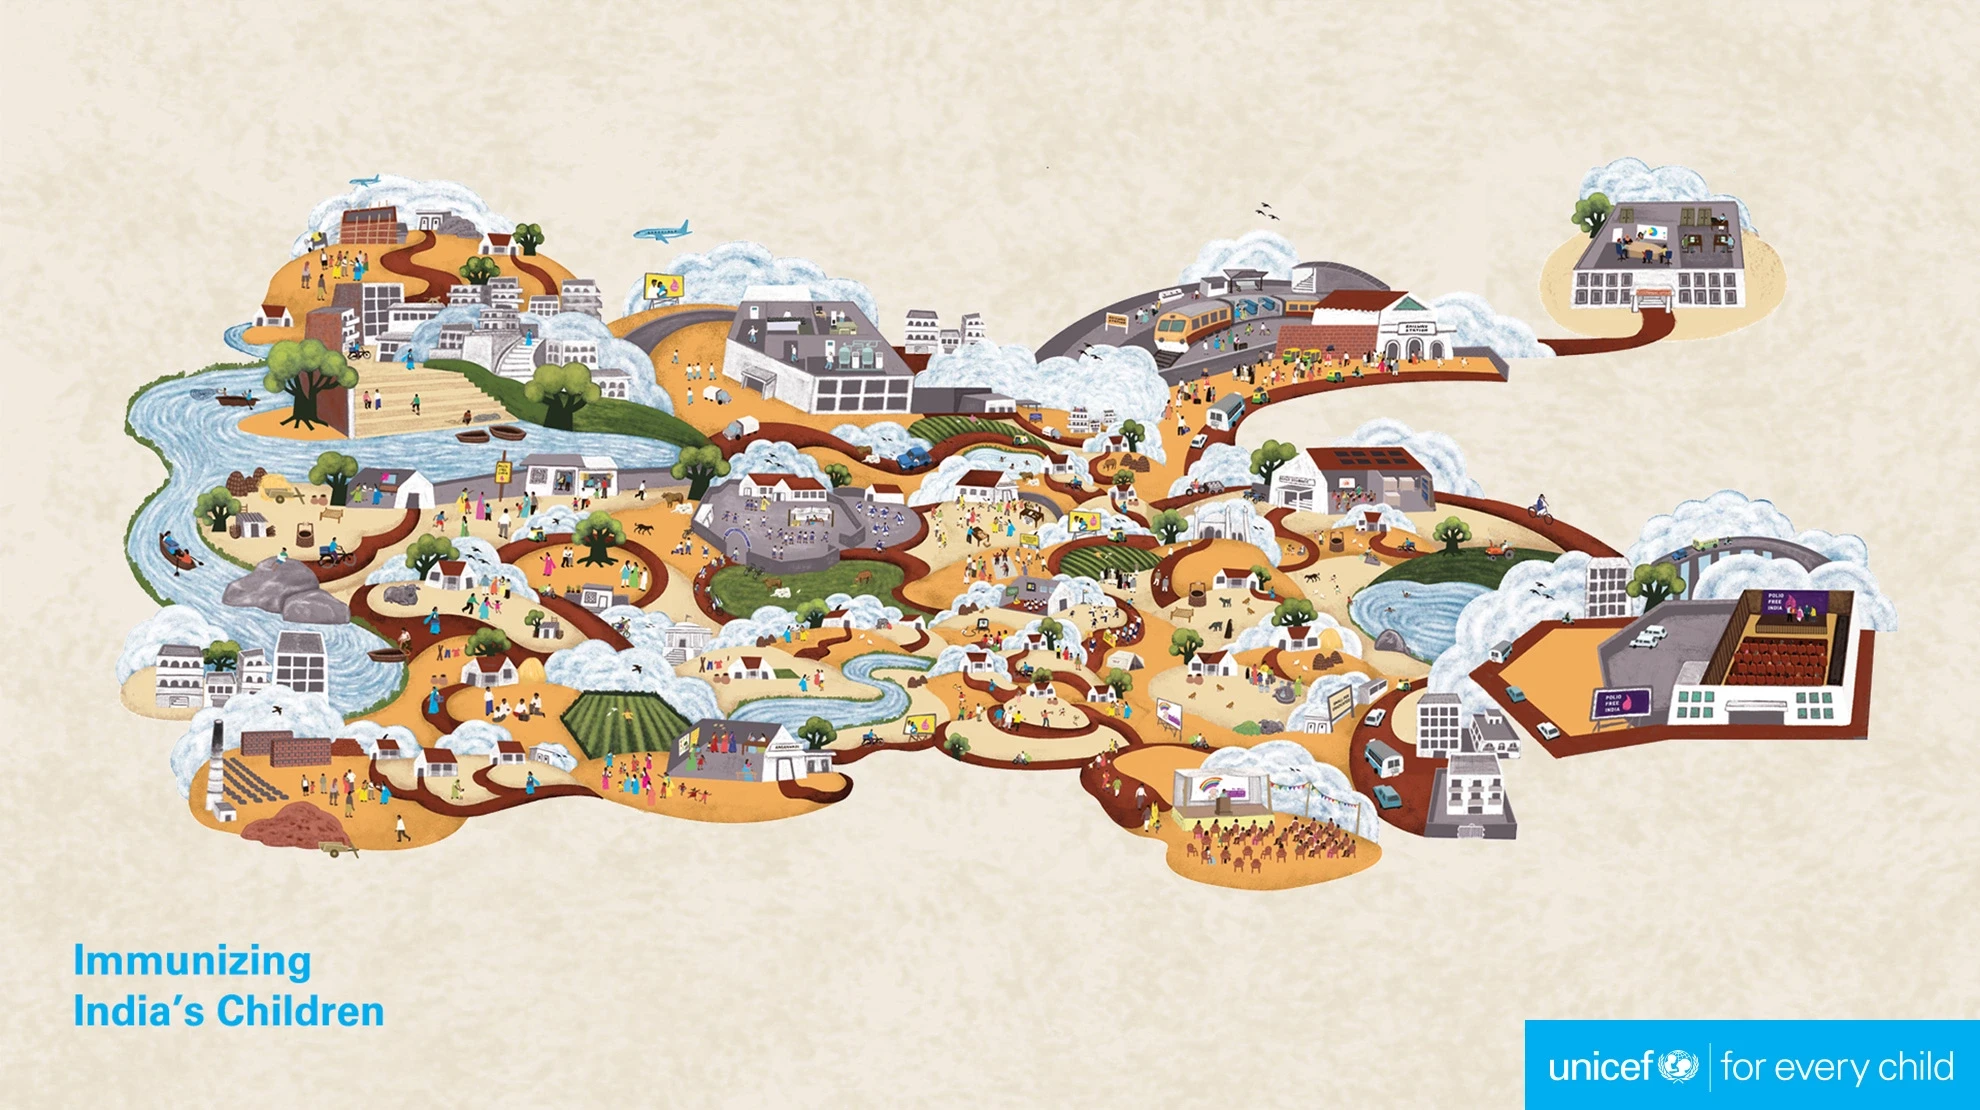
Each story emphasise on one of the 6 major areas UNICEF had contributed in India over the years.
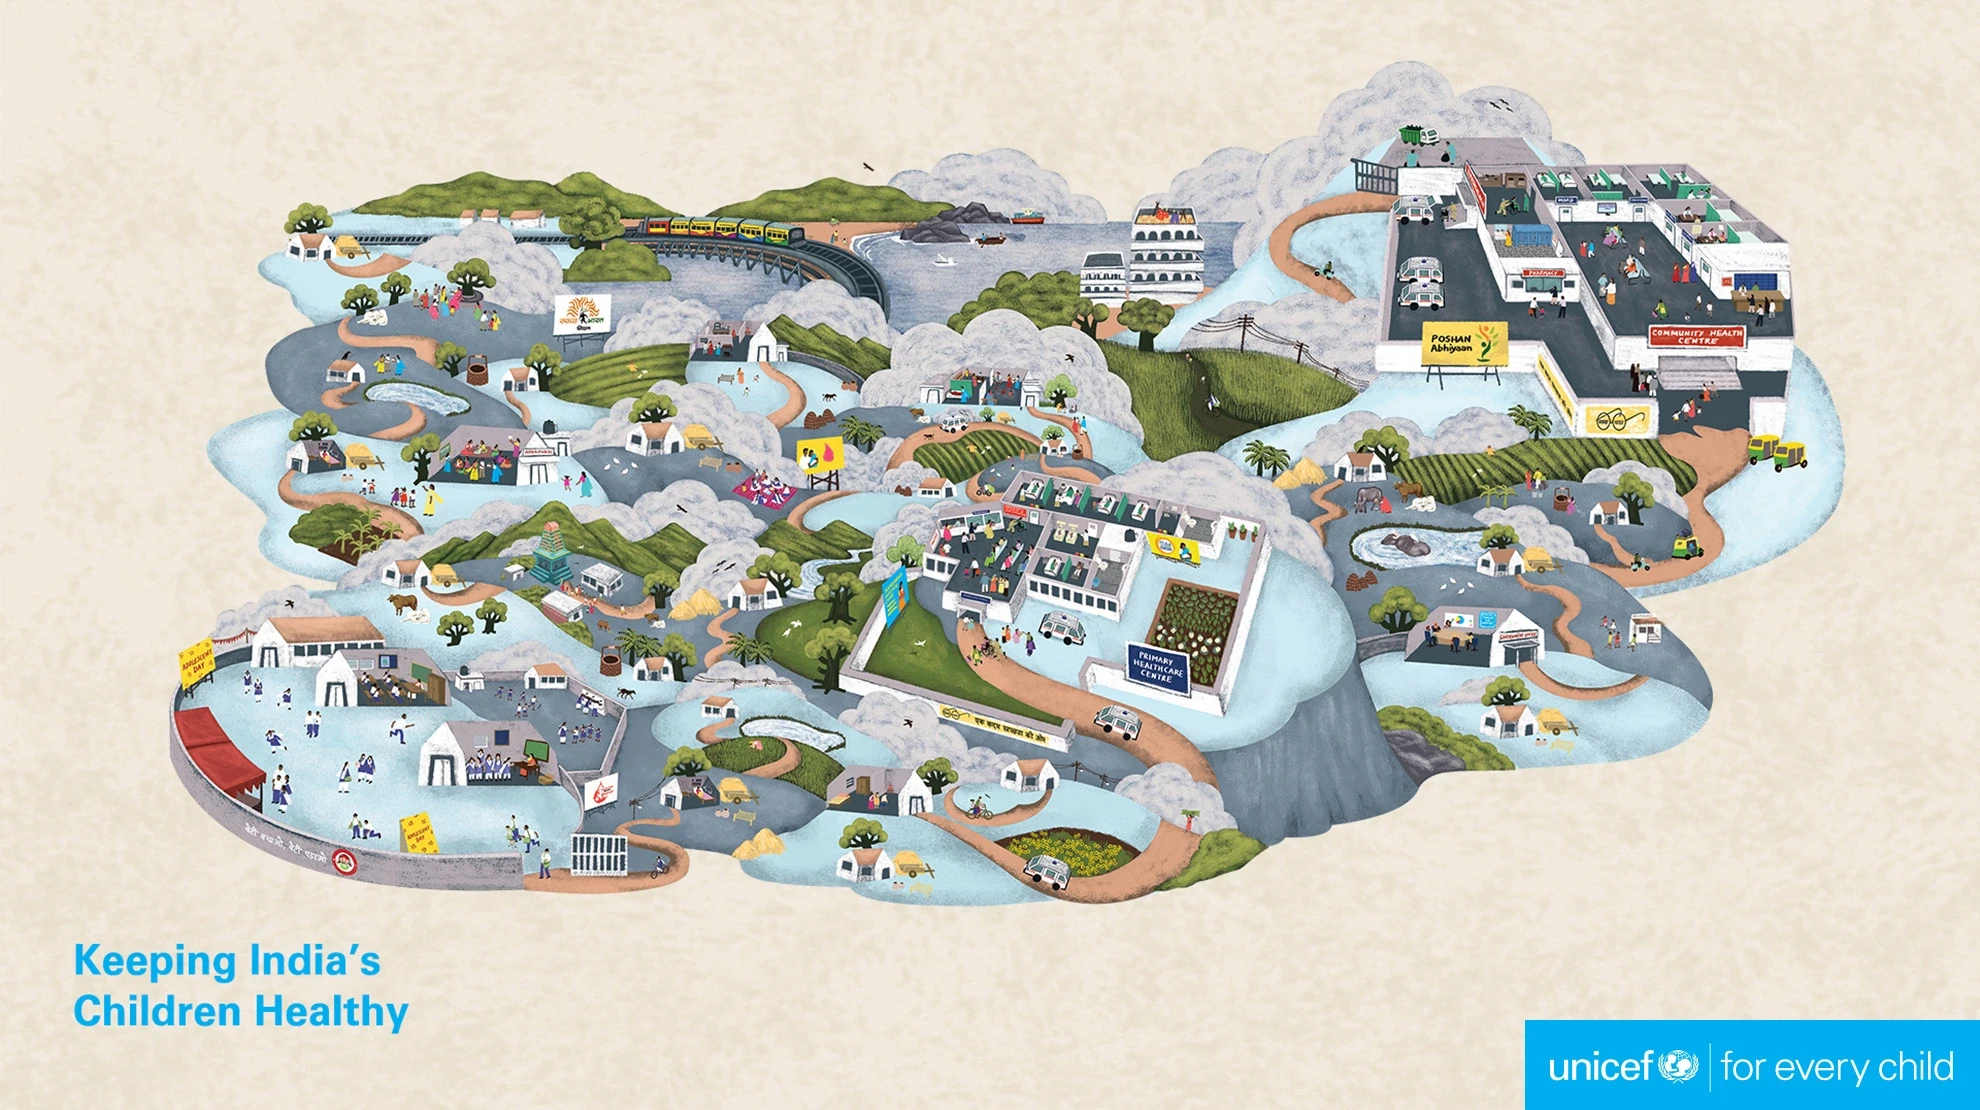
This spread discusses about Nutrition in India


After a lot of iterations, I arrived at this vertical layout that works in tandem with the vertical form factor of the calendar.

I also spilled bits of illustrations on the opposite side to the calendar layout to hint the story the other side beholds!

We also embellished the illustrations with copper foiling to all luster hinting the celebratory milestone.

Once he is on the other side the users will find a highly detailed illustrations elaborating on the success story of that particular focus area.

On scanning the illustration, it takes user to a richly illustrated landscape - the ‘World of UNICEF in India’ with many inspiring stories of interventions and achievements through partnerships.

Illustration
Starting from an A5 size calendar, we evolved to an A1 size illustration where we compiled the complete historical timeline across 70 years through different landscapes of India.
The illustration style was inspired by the Mughal miniature paintings for the flat perspective illustrations with specific and minute details. The illustration technique that evolved also allowed us to showcase the actual experiences of employees from different teams and draw references from previous brand documents.

We conducted extensive interviews with UNICEF officials respective to each focus area spanning over months to frame the story for each topic.
Once we collected all the data, we went to the drawing board to put all the data points to a sequence forming a sensible storyline.

Once mapped, we send it over to Joanna, our illustrator, towork on the illusstrations
We mapped 6 such illustrations backed by thorough research.
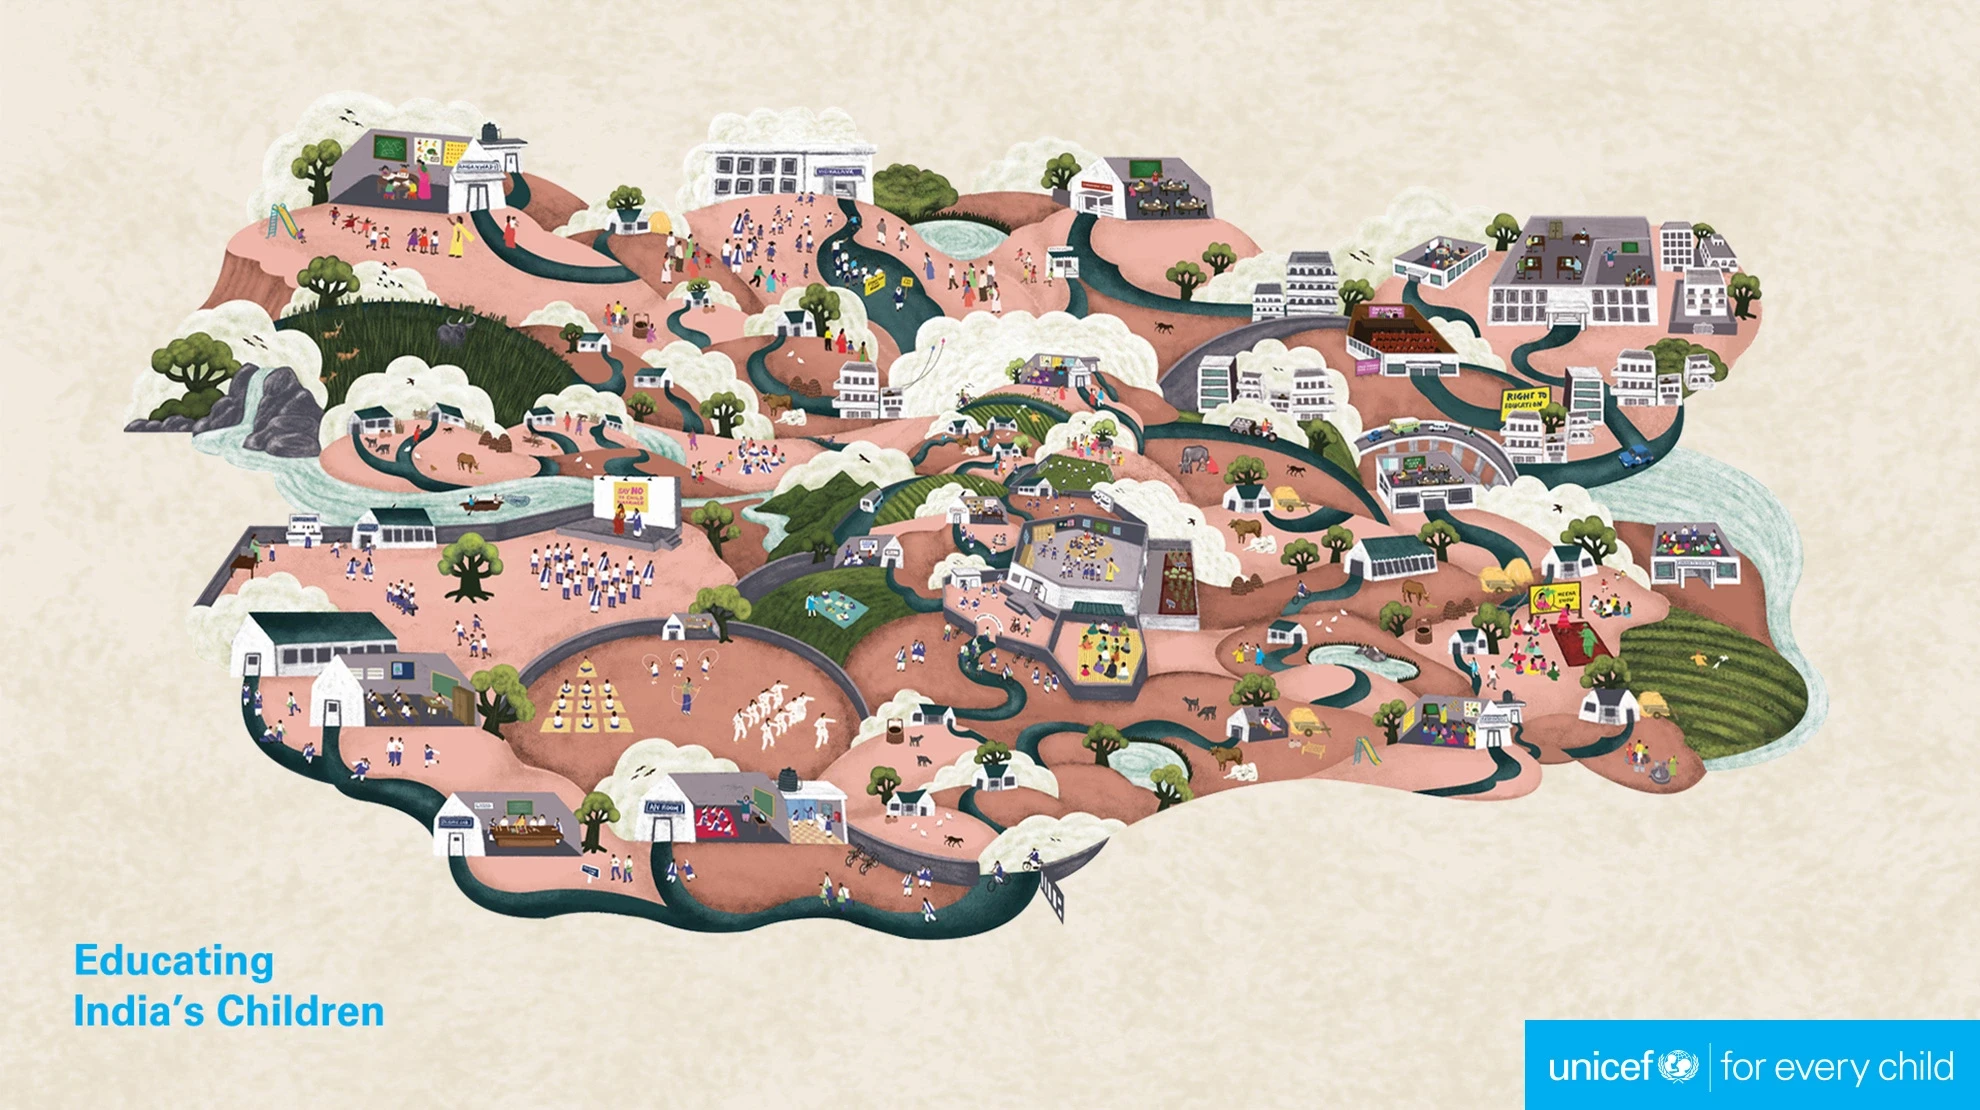
The story is told using pop-ups which are layered over the illustration and nudge you through a journey. They consist of text, slideshows and bar charts to add more context.

My Role:
A. Physical Calendar
Conceptualizing and prototyping physical calendar
Creating print ready artworks
Co-ordinating and overlooking printing process
B. App
Research and data collection from stake holders
Identifying story points and creating a narrative
Creating all graphic assets for the app
Co-ordinating with the media partner
Providing with feedbacks and improvements

